

It has been a tough month for Bitcoin and the wider market. On May 19th, a day dubbed “Black Wednesday”, Bitcoin fell 30%, along with the entire market losing more than $500 million in 24 hours.
Bitcoin has since shown a bit more fragility than usual, struggling to test above $40,000 in the past month. This has led to analysts worrying about the prospects of an imminent bear market. Today, however, it appears that the bulls have started to charge once again.
Market Update
BTC
Bitcoin has endured further drops through May, falling nearly 45% from May price highs to now sitting just under $39,000 USD. The resulting falls could be the result of recent mainstream news articles painting Bitcoin in a bad light, as well as a series of tweets from Elon Musk that has been widely described as being highly irrational by those in the cryptocurrency space.
On a positive note, May and June have seen some incredible news and adoption for Bitcoin, with many major banks and countries adopting the digital currency. More notably, the news on May 7th that Goldman Sachs began offering Bitcoin derivative products to investors sparked interest, as well as news that El Salvador passed legislation to adopt Bitcoin as legal tender on June 9th. The news from El Salvador in particular has incited other Latin American politicians from Brazil, Panama, Argentina, and more, to consider the possibility of going down a similar route.
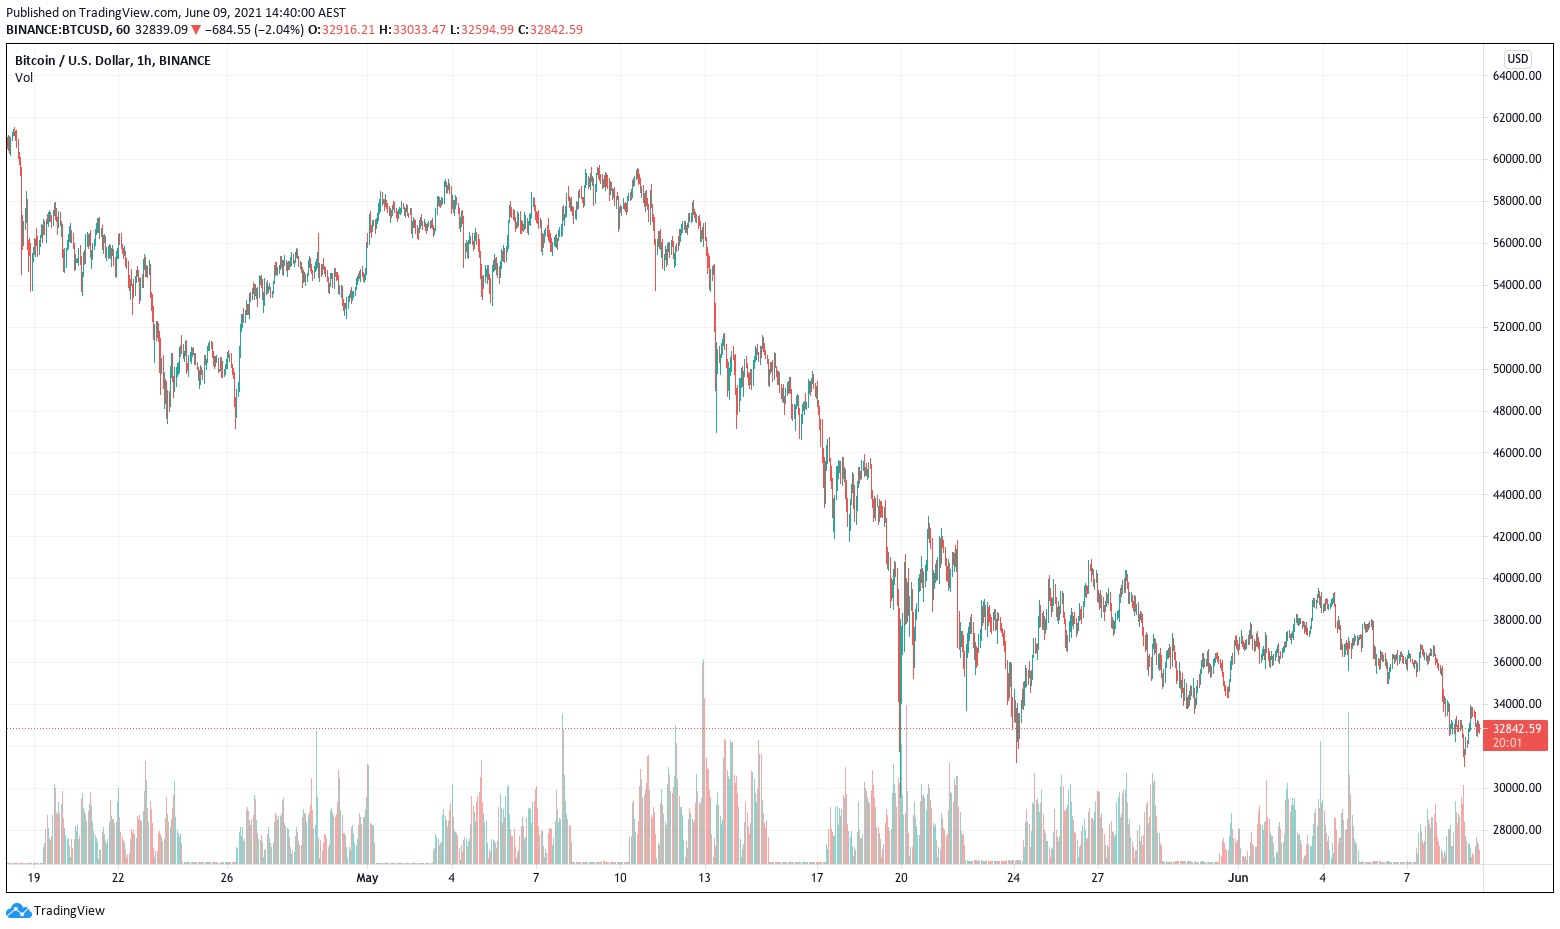
Further inspection into Elon Musk’s tweets can provide further insights into just how much of an effect he is able to have on the market. On May 12th, Elon announced via Twitter that Tesla would no longer be accepting payments in Bitcoin, which resulted in a 15% fall in its price. Elon then later made suggestions on May 16th that Tesla was going to be selling all their holdings, causing another 4% fall; the suggestion has since been shown to be false. His most recent stunt involved posting a meme captioned ‘💔 Bitcoin’, which again, caused a 10% fall in the price during a very critical breakout period of $40,000 USD.
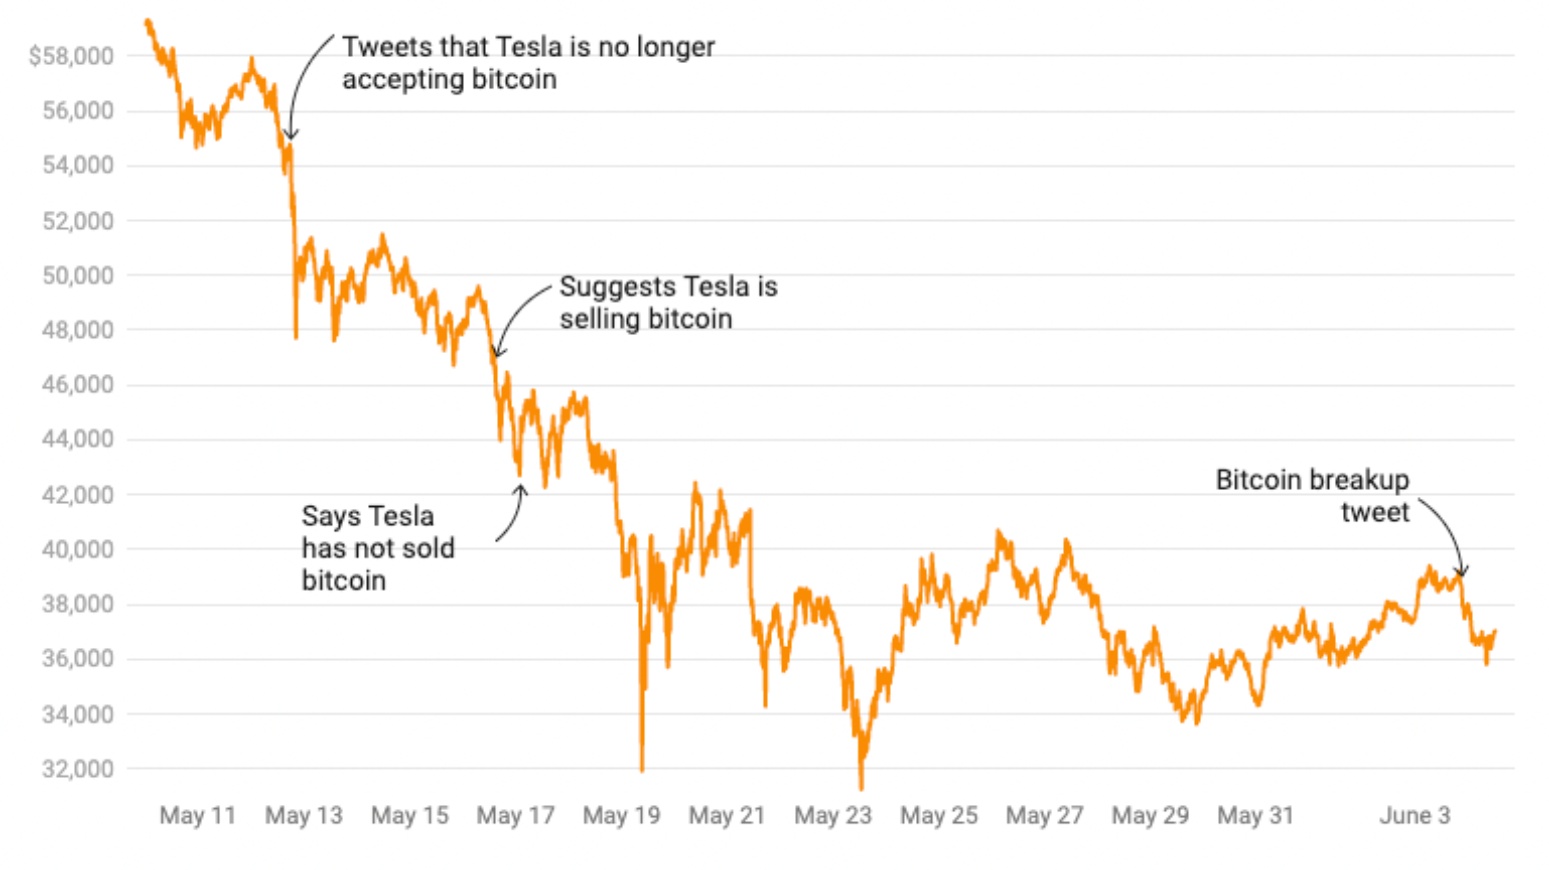
The behaviour shocked much of the cryptocurrency community, as his online presence in the space has begun to take on an increasingly negative light. After all, recalling February this year, Elon Musk had announced Tesla's $1.5 Billion purchase of Bitcoin, spurring a heightened bull run to all-time-highs in the following months.
As a matter of fact, today Elon Musk says Tesla will start accepting Bitcoin (BTC) payments once there’s confirmation that miners are utilizing clean energy, “When there’s confirmation of reasonable (~50%) clean energy usage by miners with a positive future trend, Tesla will resume allowing Bitcoin transactions.” Bitcoin popped nearly 5% after the tweet.
However, this new level of irrational exuberance from Elon Musk also highlights the mindset of retail investors within the space - dependent on tweets of one individual even though underlying fundamentals are unchanged.
ETH
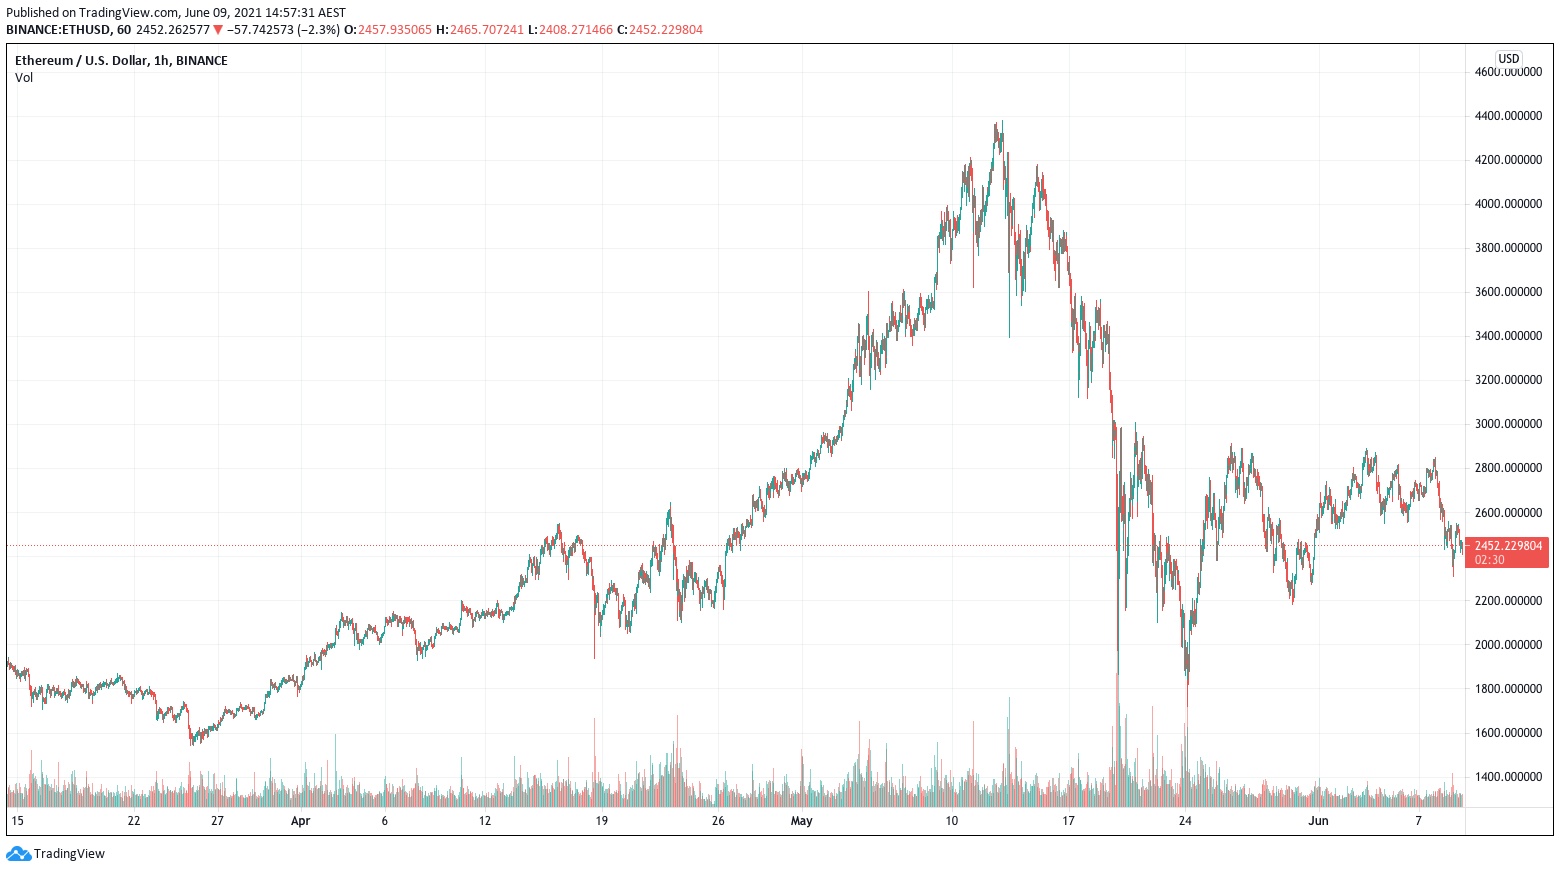
Ethereum continued to climb higher through the beginning of May, after the successful launch of its Berlin Hard Fork (a network upgrade on April 15th), reaching a new all-time-high of $4,356.99. However, following the negative news surrounding Elon Musk and progressive falls in the market throughout the month, Ethereum is currently sitting 43.9% lower than these previous highs. Ethereum is still showing bullish signs as the network’s London hard fork in July promises significantly cheaper transaction fees, dynamic block sizes and most importantly, the implementation of a burn function (burning of the base network fee) which will put deflationary pressure on the currency over the long run. For further clarification, please check out our article titled, ‘The Big Four: Smart Contract Platforms’
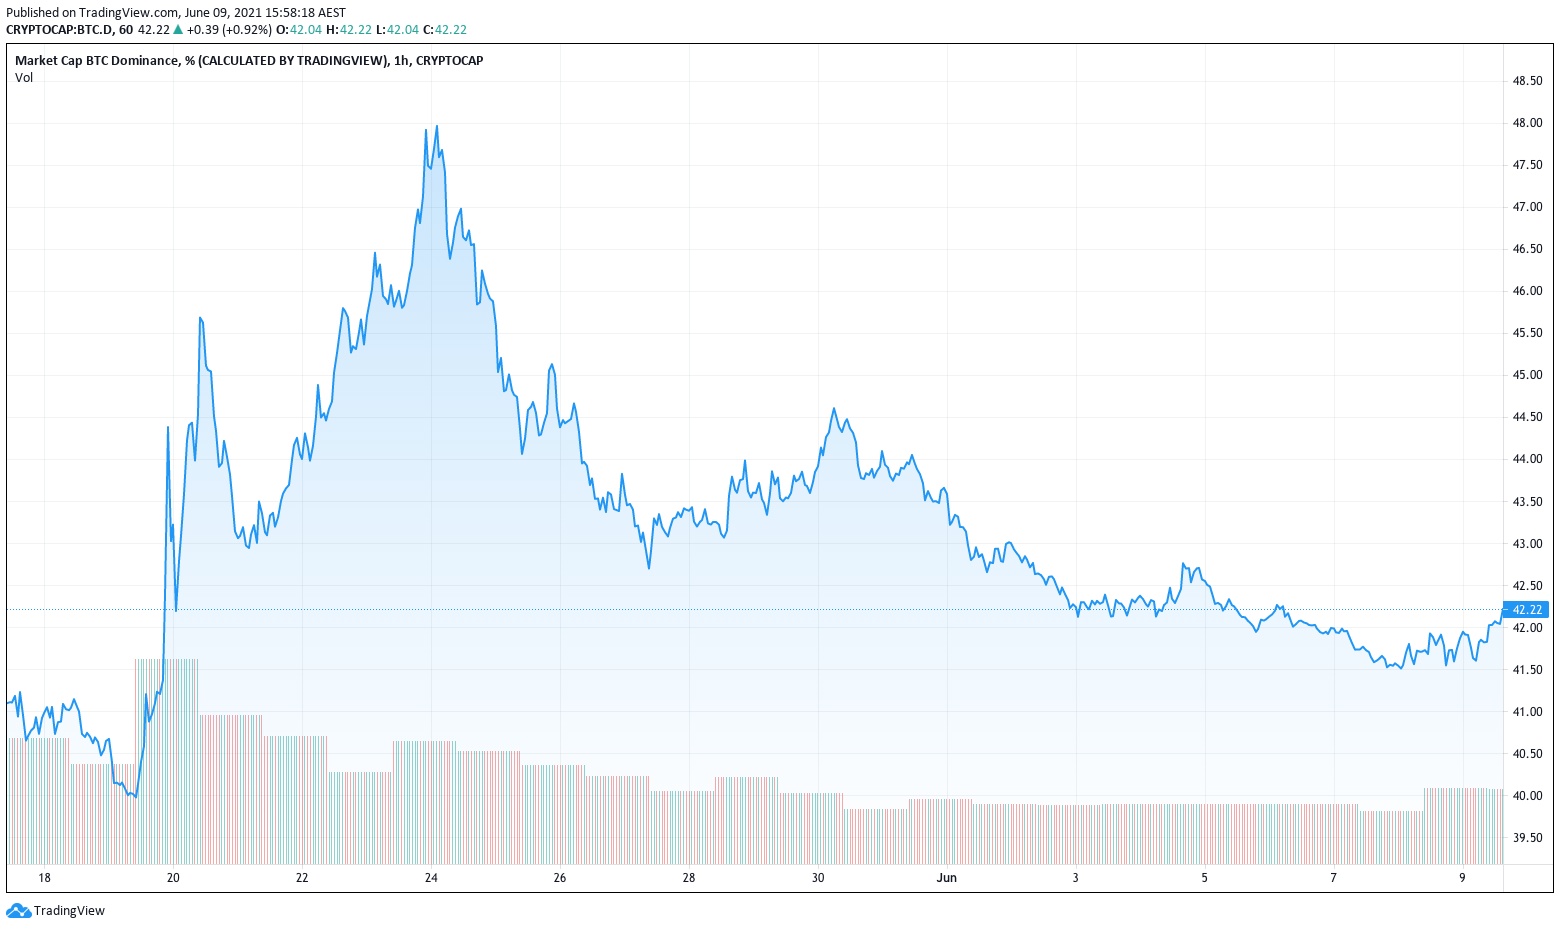
The rises in Ethereum and corresponding falls in Bitcoin throughout May created a significant downward trend in the Bitcoin Dominance Index. Typically, a falling Bitcoin Dominance Index is followed by substantial inflows into altcoins. In this current market cycle it was no different, with Bitcoin’s price dominance against the altcoin market to weaken. Consequently, bringing in a new wave of lucrative returns to investors. The Bitcoin Dominance Index fell to as low as 40%, a level not seen since the days of 2018, highlighting the outflows from Bitcoin into the wider altcoin market.
However, this was short lived as a further price correction in Bitcoin resulted in a massive altcoin sell-off, with many 50-80% down from highs a week ago. This created an unprecedented amount of uncertainty and fear in the market, leading to money moving from altcoins into assets with a bit more stability and size, such as Bitcoin, Ethereum or now more commonly, stablecoins like Tether (USDT). Currently, there is over $16 billion in stablecoin reserves, the highest level ever recorded in history.
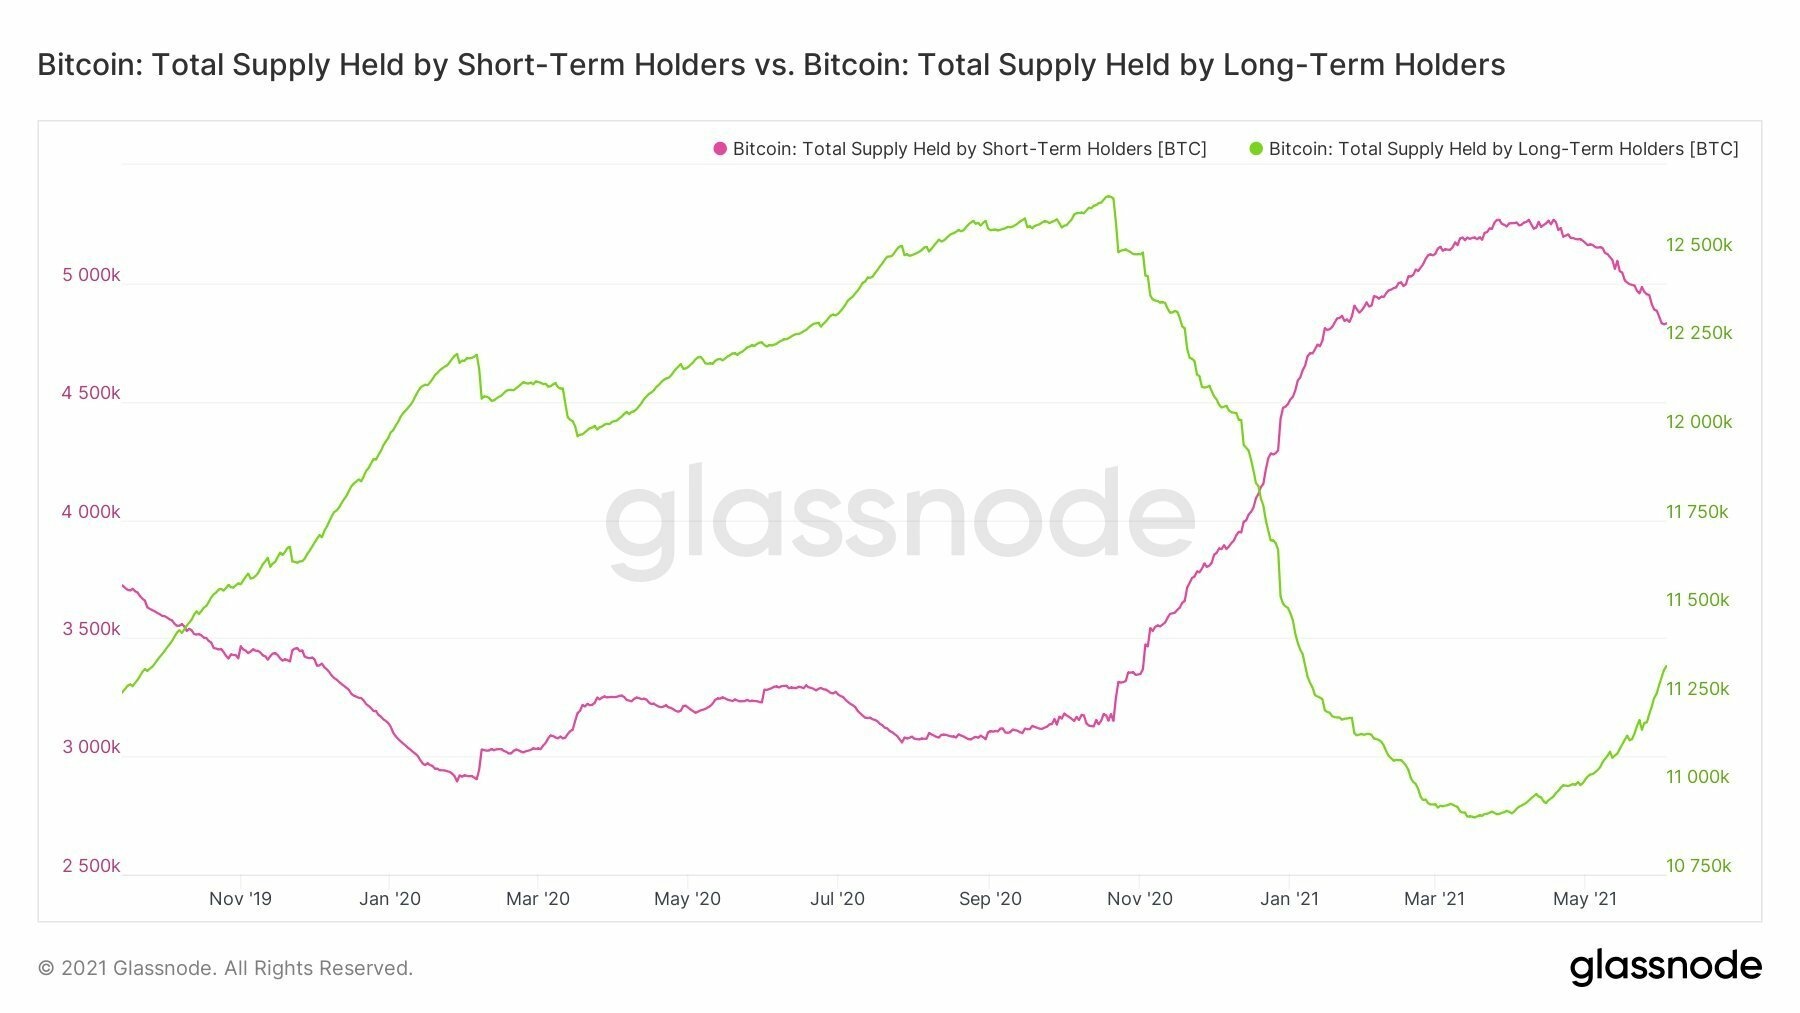
Looking closer at these recent selloffs and the data they provide, we are able to see that the recent selloffs have been predominantly due to Bitcoin investors who held in the short-term, as the graph below displays. Short-term holder supply levels are falling, spurring on from long-term holders beginning to accumulate more Bitcoin paired with the short term holders selling their Bitcoin. This is a sign of a consolidation phase in the market, where Bitcoin is transferred back from short-term holders to investors with long-term outlooks, creating a solid base for prices to potentially rise from.
What does on-chain data tell us?
The May crypto market selloff saw $1.2 trillion in value erased from the total market capitalization, as excess leverage of over-exuberant markets was swiftly wiped out. According to data from market intelligence experts Glassnode, the month of May saw a historically large decline in on-chain activity, in contrast to booming on-chain economies with ATH prices seen in the month of April.
The drop in activity has resulted in a 65% drop in total USD-denominated transfer volume settled by the Bitcoin network, and a 60% drop in value transferred on Ethereum, marking the networks' second-largest drops behind Bitcoin's 80% fall in 2017, and Ethereum's 95% fall in 2018.
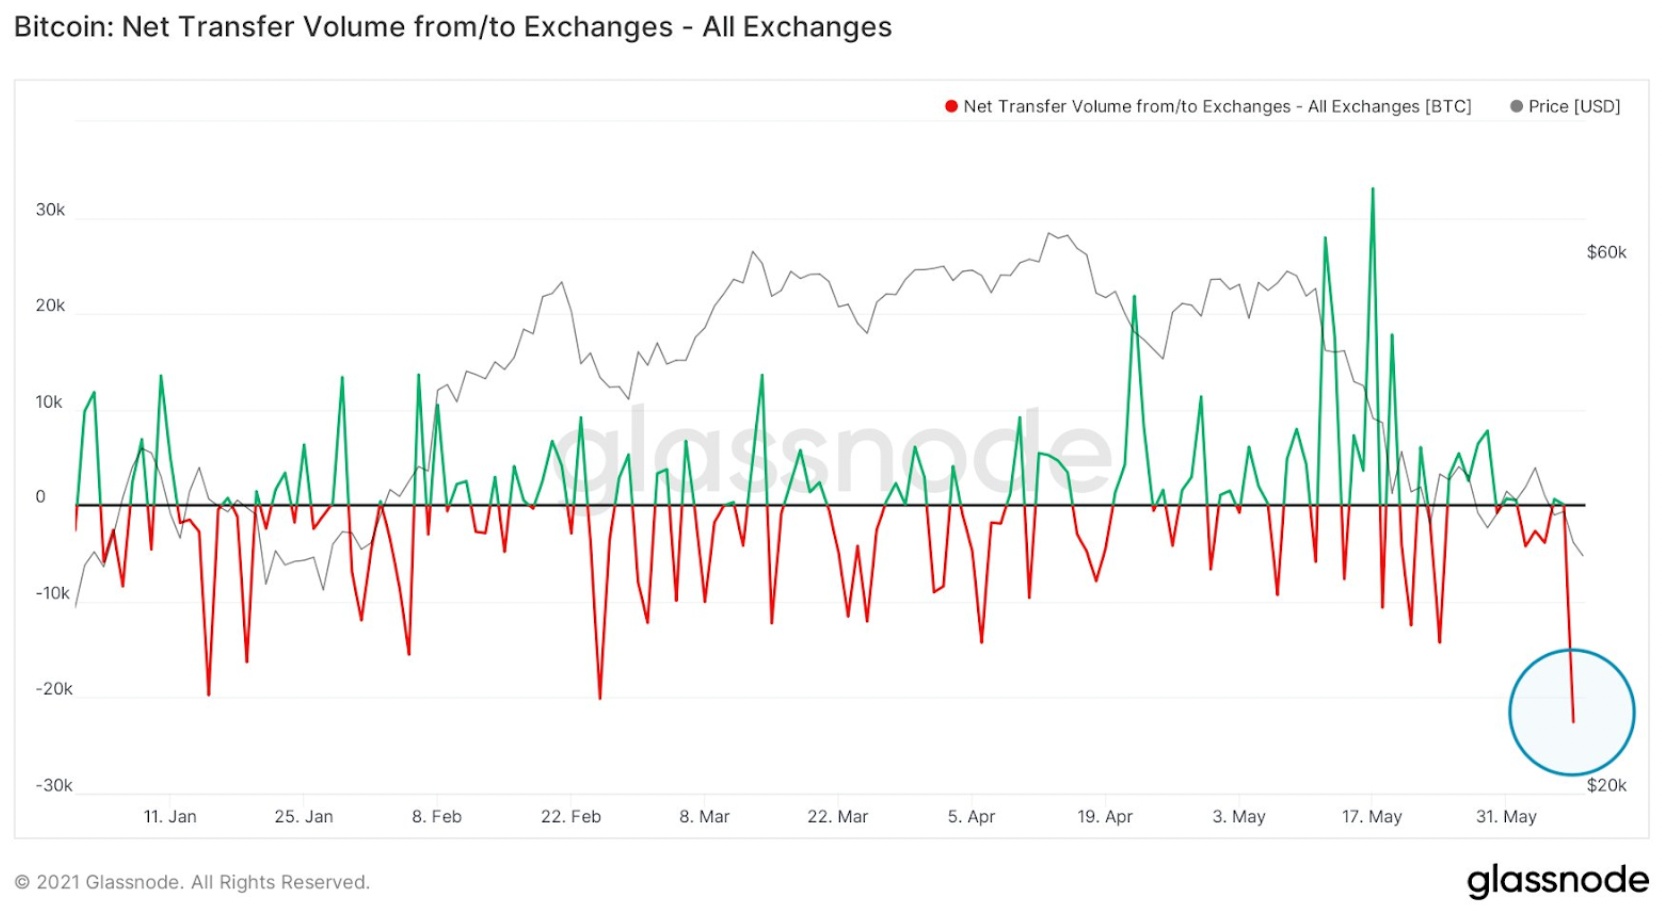
Retail investors and short-term holders were hit hardest by the dip. Whilst on-chain activity does look bearish for some, it seems that long-term holders have been accumulating at this level upon closer inspection. Holdings of Bitcoin whales, which are cryptocurrency wallet addresses holding between 100-10,000 BTC, have been steadily increasing for two and a half weeks. Furthermore, 22,500 Bitcoins were withdrawn from exchanges on June 7th alone. This could be a sign that the worst has been done and dusted, as whales are buying with confidence and the market has seen the biggest net outflow of the year thus far.
Bull/Bear Trap
As many of us know, the cryptocurrency market is able to create and destroy wealth at an unrelenting pace with a plethora of tricks and traps that the uninitiated can fall into. The bull and bear trap is one of them. In the trajectory that we are heading, we have to concede the possibility that these traps may happen.
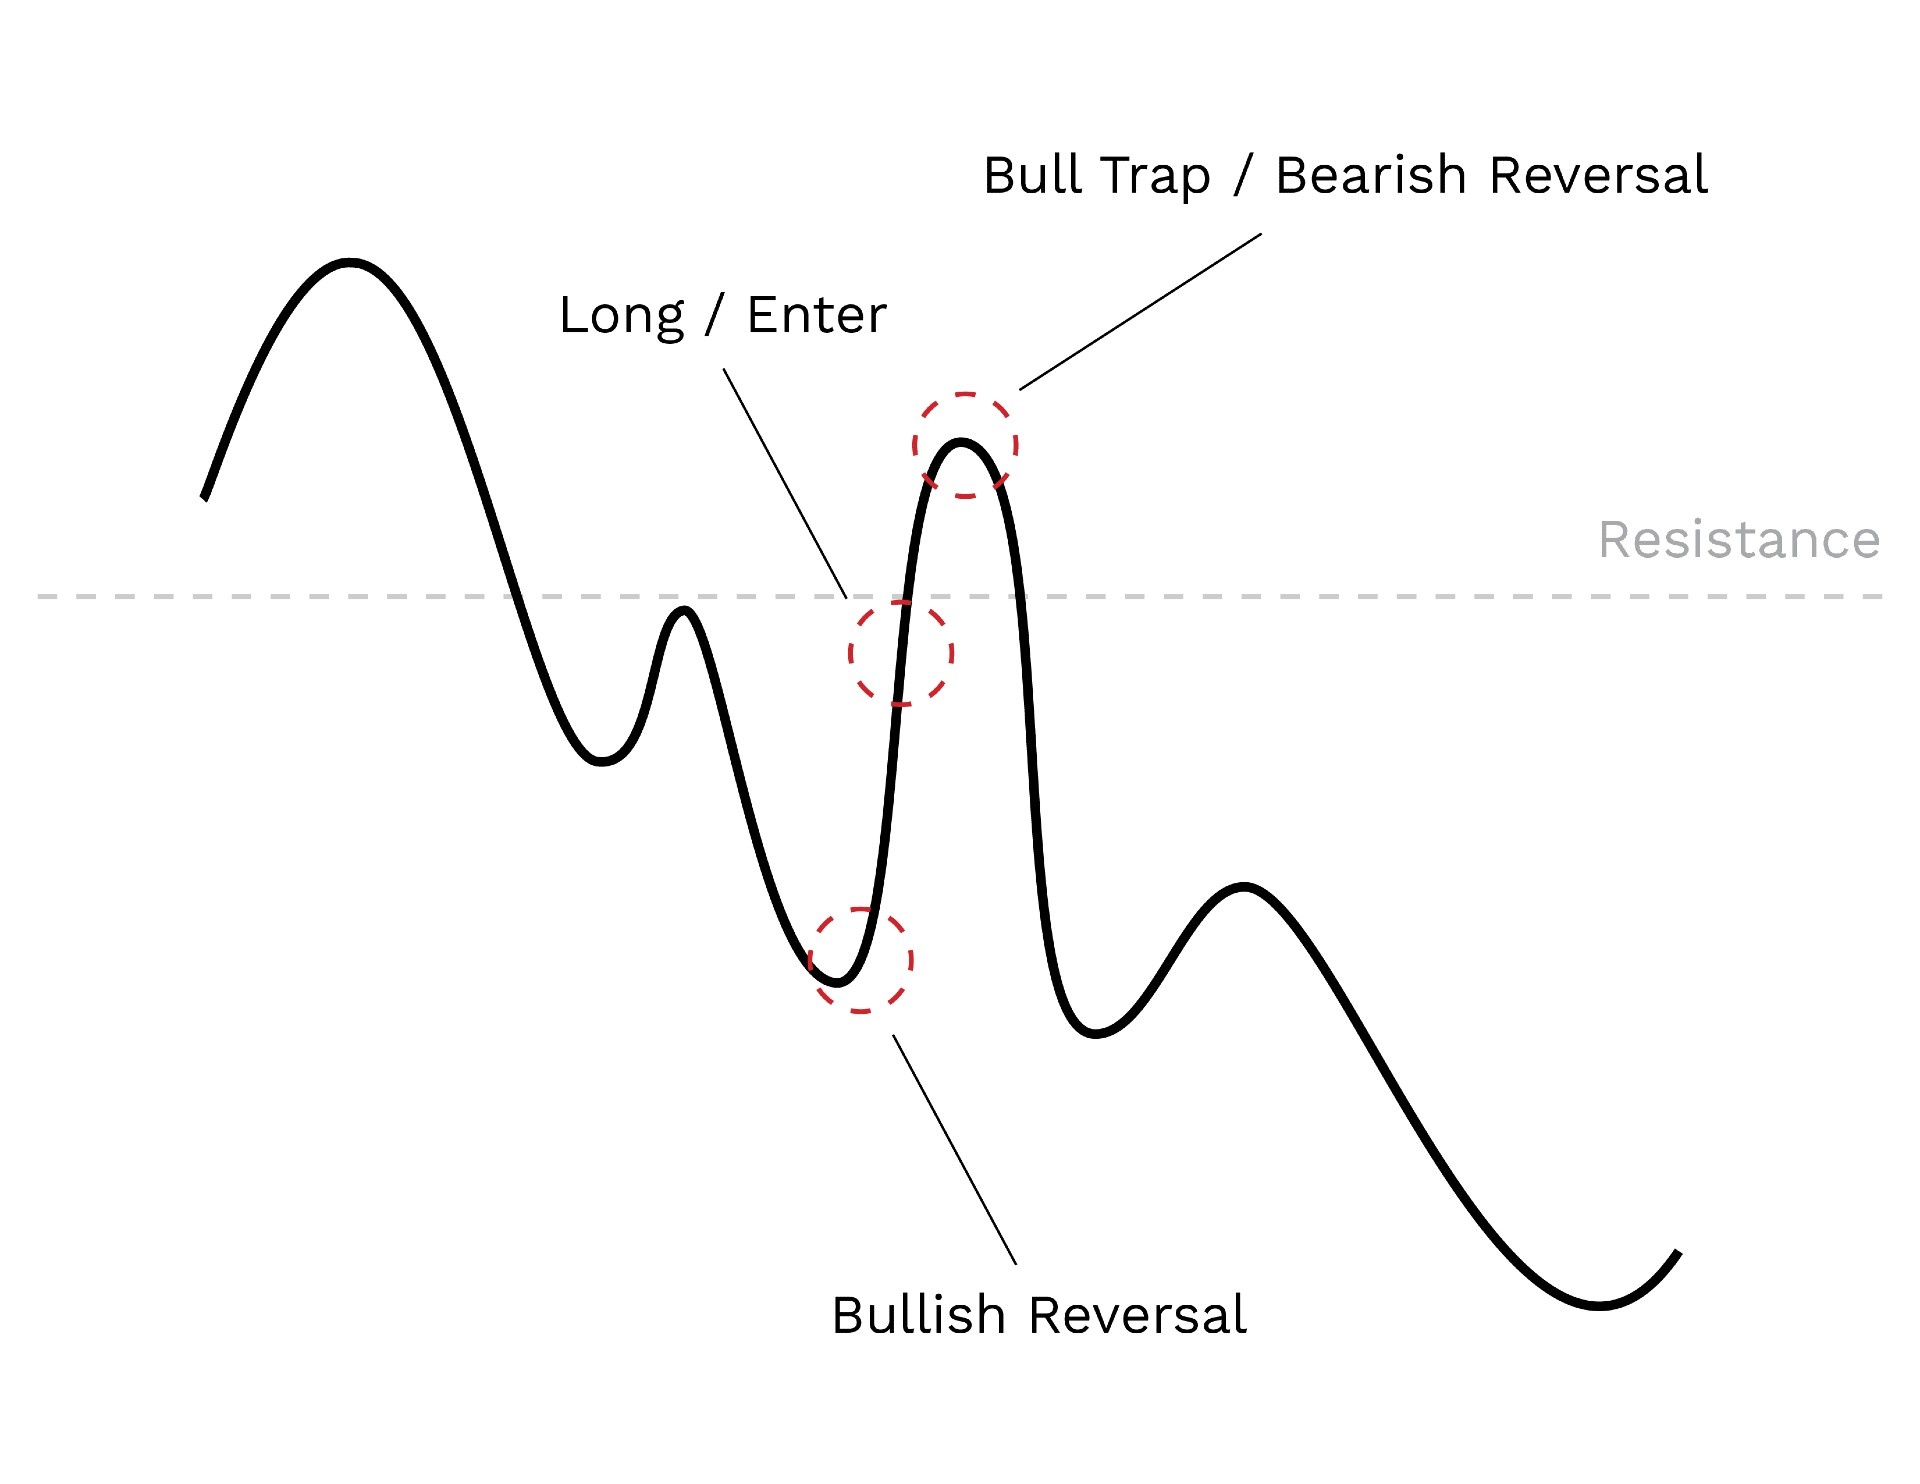
Firstly, the bull trap is a false signal referring to a quick price increase during a downtrend. This can trap traders that acted on the buy signal, generating losses on the resulting long position. A bull trap occurs when an investor buys a token that is breaking out above a resistance level - a common strategy used by most. While many breakouts are followed by strong momentum upwards, the asset may swiftly reverse direction.
Conversely, the opposite of a bull trap is a bear trap, which occurs when there is a false indication of a reversal of a rising price trend. A bear trap can prompt an investor to expect a continued decline on the asset after breaking below a support level, tempting investors to short or exit a position on the asset. However, in this scenario, the asset stays flat or rallies, and the investor is forced to incur a loss.
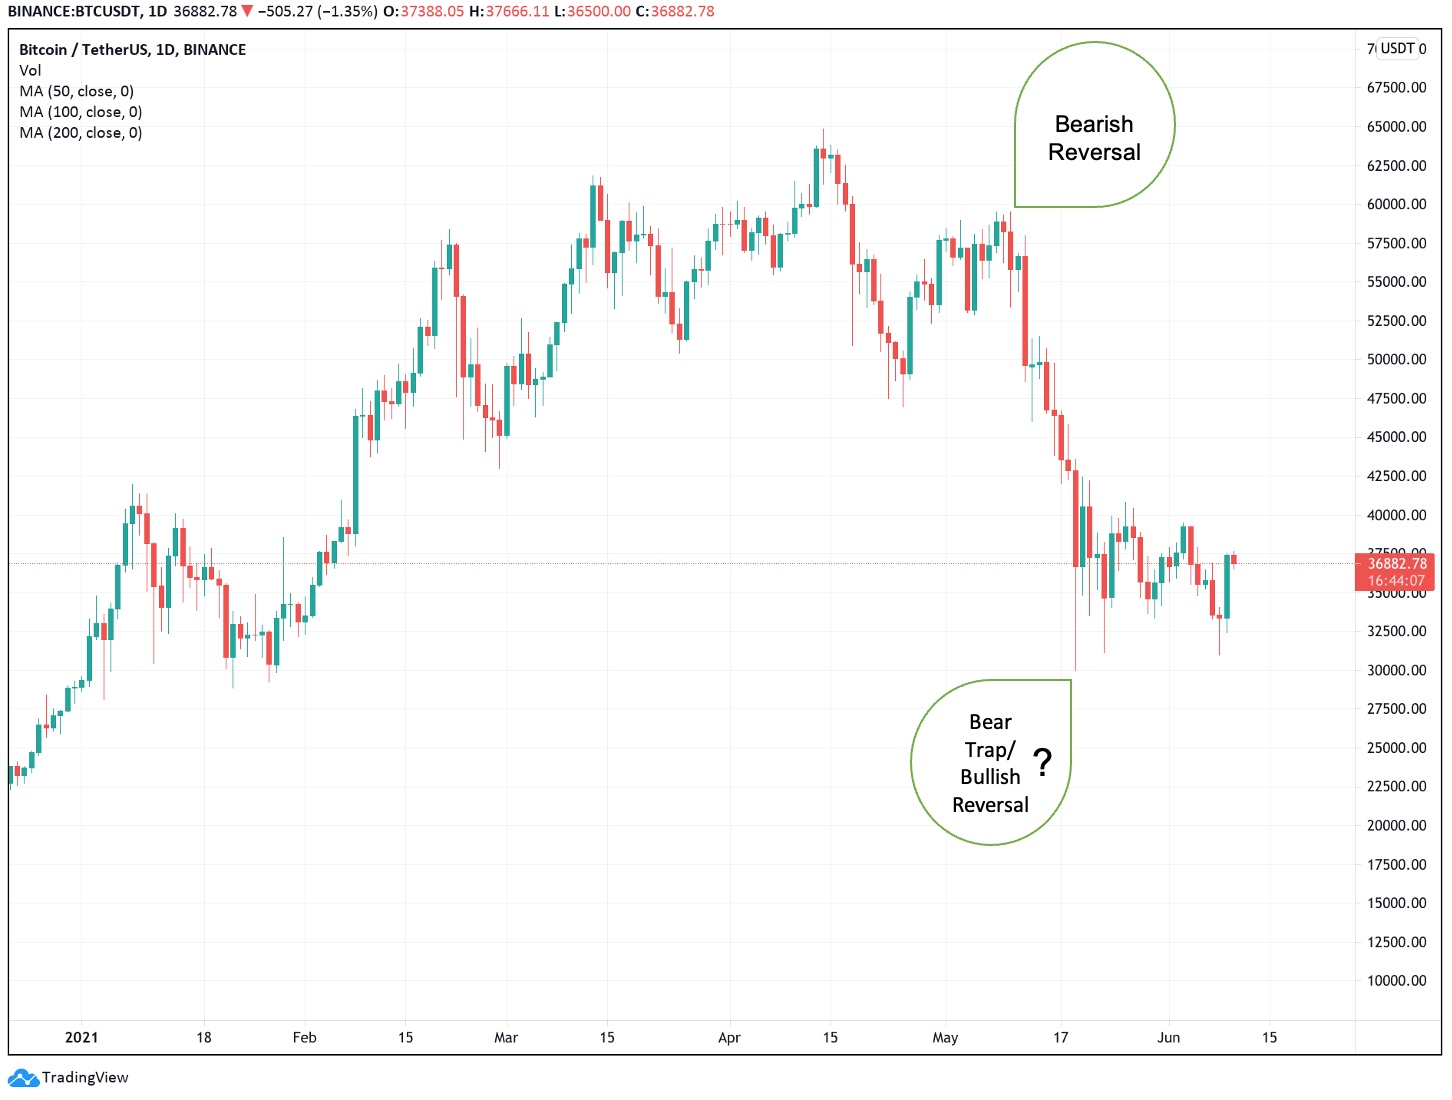
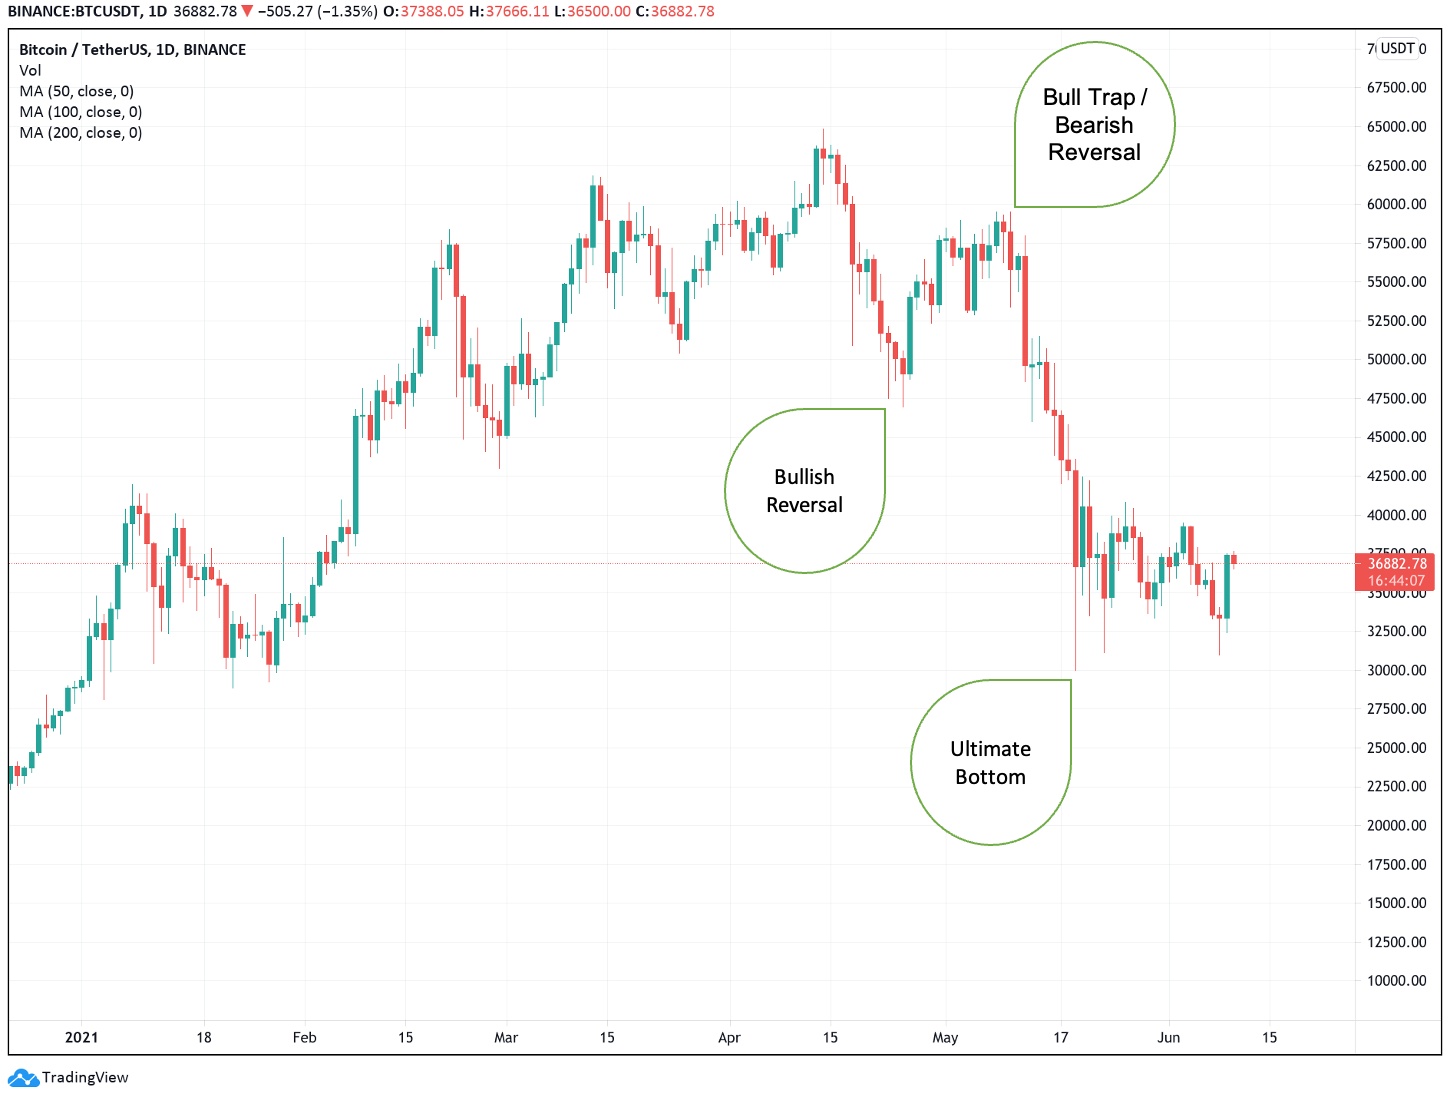
Bear and bull traps can be hard to identify due to personal biases and general uncertainty towards the future. For instance, a recent example would be Bitcoin’s timeframe from March 2021 to present day, where there are arguments for both sides - bull trap and bear trap.
The bull trap is possible, as we have been on a general downtrend since ATH in April. We then had a bullish reversal at $47,000, where Bitcoin’s prices spiked and broke past resistance of $58,000. However, we broke back down and have been on a bearish reversal ever since. A bull trap would indicate that the bottom is not in and we will expect lower prices in the short term.
Conversely, Bitcoin has been on a massive rally up since the COVID correction in March, which would signal a general rising trend. The bearish reversal at the start of May could have been a false indication of a reversal of a rising price trend. If we are currently in a bear trap, we can expect the rising trend to continue.
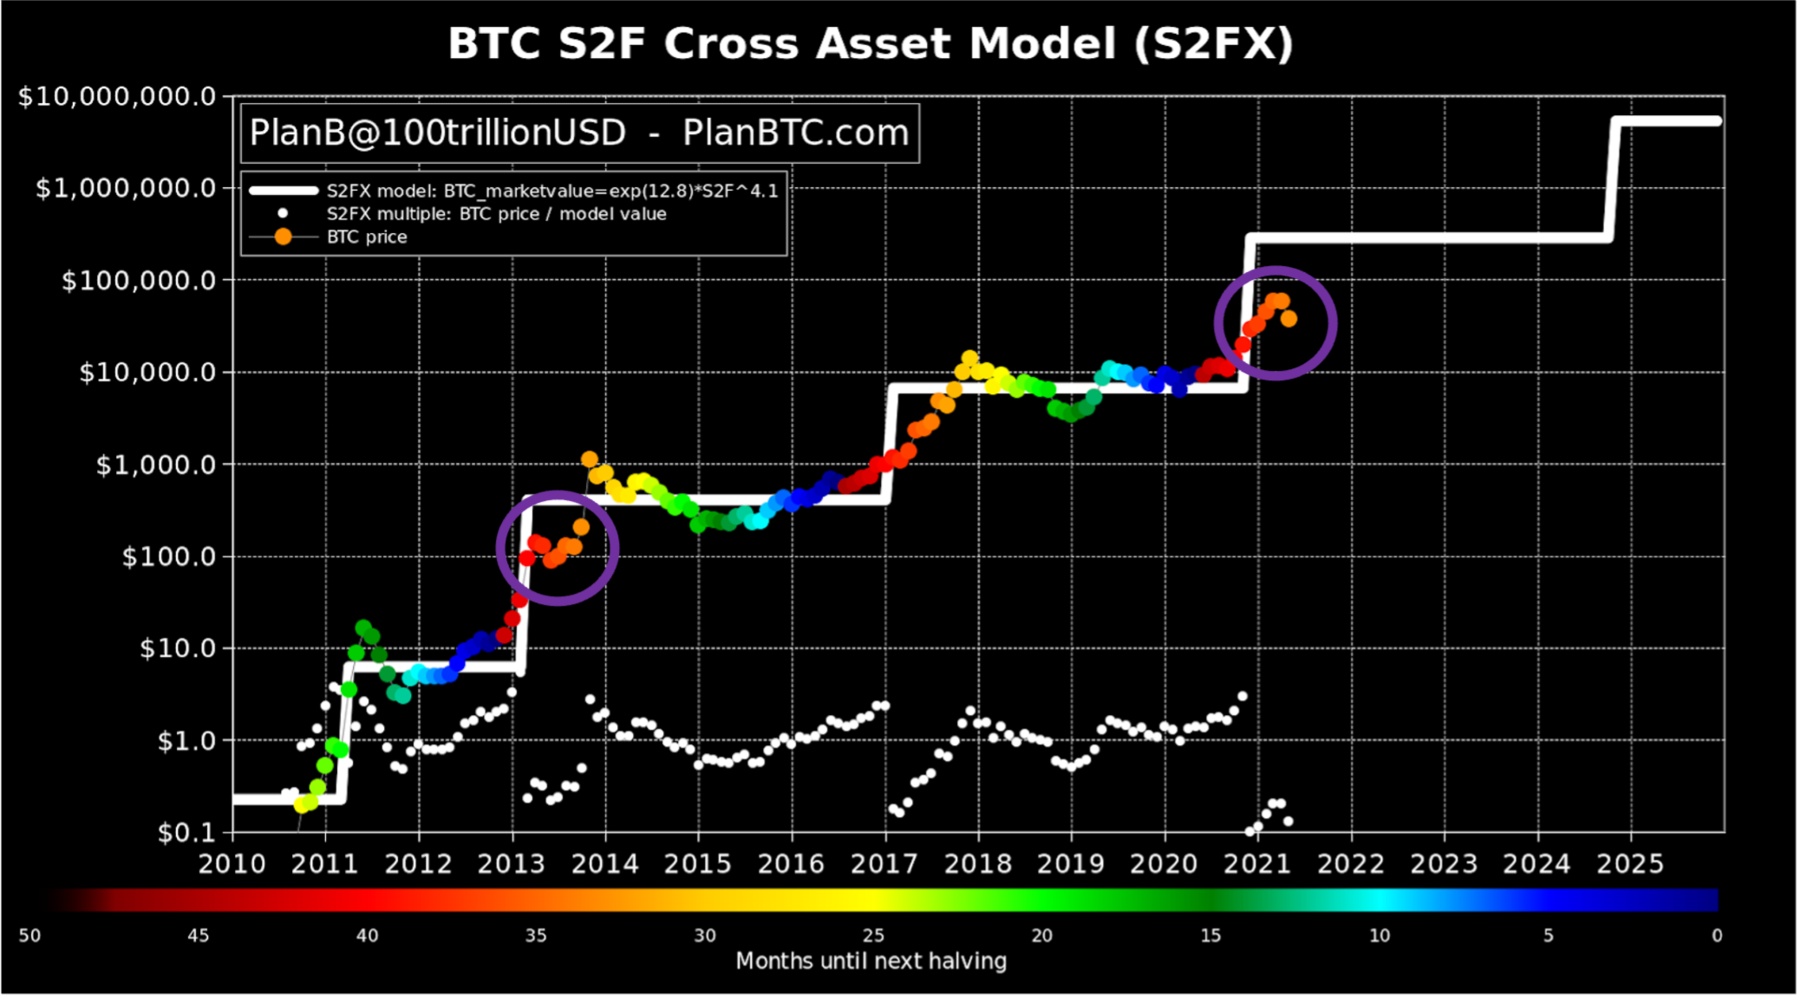
Stock to Flow
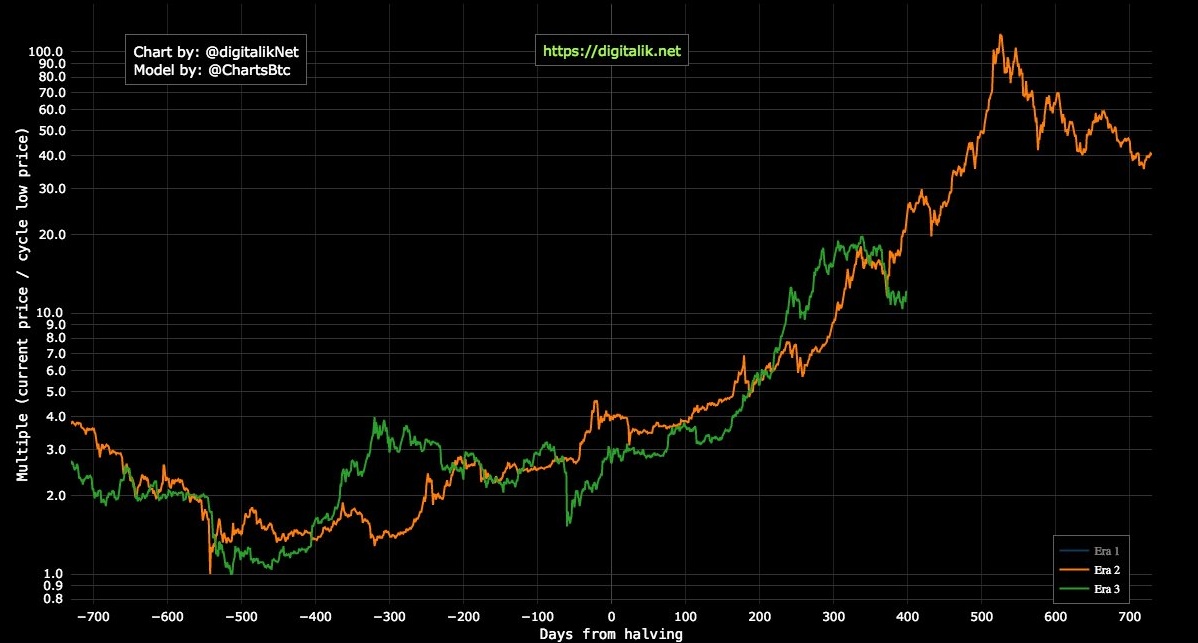
Zooming out, after closing May at $37,341, the BTC Stock to Flow model is showing eerie similarities to 2013, where Bitcoin fell to as low as $83.49 then rallying up to $1220.91 nearly 8 months later. Following the Stock to Flow model, Bitcoin is estimated to reach an average price of $250,000 per BTC.
Drawing further parallels this fall in price has occurred in a similar time frame to that of 2017 whereby 372 days after the July 9th 2016 halving we saw a 42% fall in the price of Bitcoin, compare that to today 373 days after the May 11th 2020 halving we endured a 50% crash. In the previous market cycle of 2017, after the 42% drop, Bitcoin rallied in the following months rising nearly 1000% from the bottom to the peak of the 2017/2018 Bull run. Obviously past performance does not predict future performance, but it does paint this recent drop in a new light rather than being seen as a bearish sell signal. Instead, it could be seen as an amazing buying opportunity to allow investors to enter in at a price we may never see again.
Conclusion
Bitcoin’s mainstream appearance will continue to be scrutinised by traditional finance and political figures especially during times of wider spread adoption. The on-chain data points to strong fundamentals and continued growth, however, over the short term it is clear that hurdles will arise as they have in the past. Bitcoin’s adoption as a legal tender in El Salvador is the largest news we have received to date and yet market sentiment seems to be staying uncertain on cryptocurrencies’ long term success. The cryptocurrency ecosystem will continue to push boundaries and develop over time as more widespread exposure catches the eyes of more nations like El Salvador who are able to take full advantage of blockchain technology and Bitcoin.

.webp?u=https%3A%2F%2Fimages.ctfassets.net%2F4ua9vnmkuhzj%2F7meVnT2vnQelBrt6W5yw73%2F8469fbdea8168e404fff363b35dd65a4%2FBitcoin_Halving-01__1_.jpg&a=w%3D3840%26h%3D2160%26fm%3Dwebp%26q%3D80&cd=2023-01-10T02%3A22%3A06.649Z)
.webp?u=https%3A%2F%2Fimages.ctfassets.net%2F4ua9vnmkuhzj%2FuIaUbUNRbO1LdljRWKvoI%2Fd93965ff275cd47f8c19fcc71edcd42e%2FBitcoins_Market_Cycle_V3-01__1_.jpg&a=w%3D3840%26h%3D2160%26fm%3Dwebp%26q%3D80&cd=2023-02-21T06%3A17%3A39.793Z)


