

Bitcoin
May has been a painful month for cryptocurrency investors. After making a high at $40,000 at the start of the month, Bitcoin bottomed at $27k, losing a third of its value. Currently, Bitcoin is floating above the $31k mark which is 16% up from its lows. The Bitcoin Fear and Greed Index is currently at one of its lowest points (10/100), indicating extreme fear.
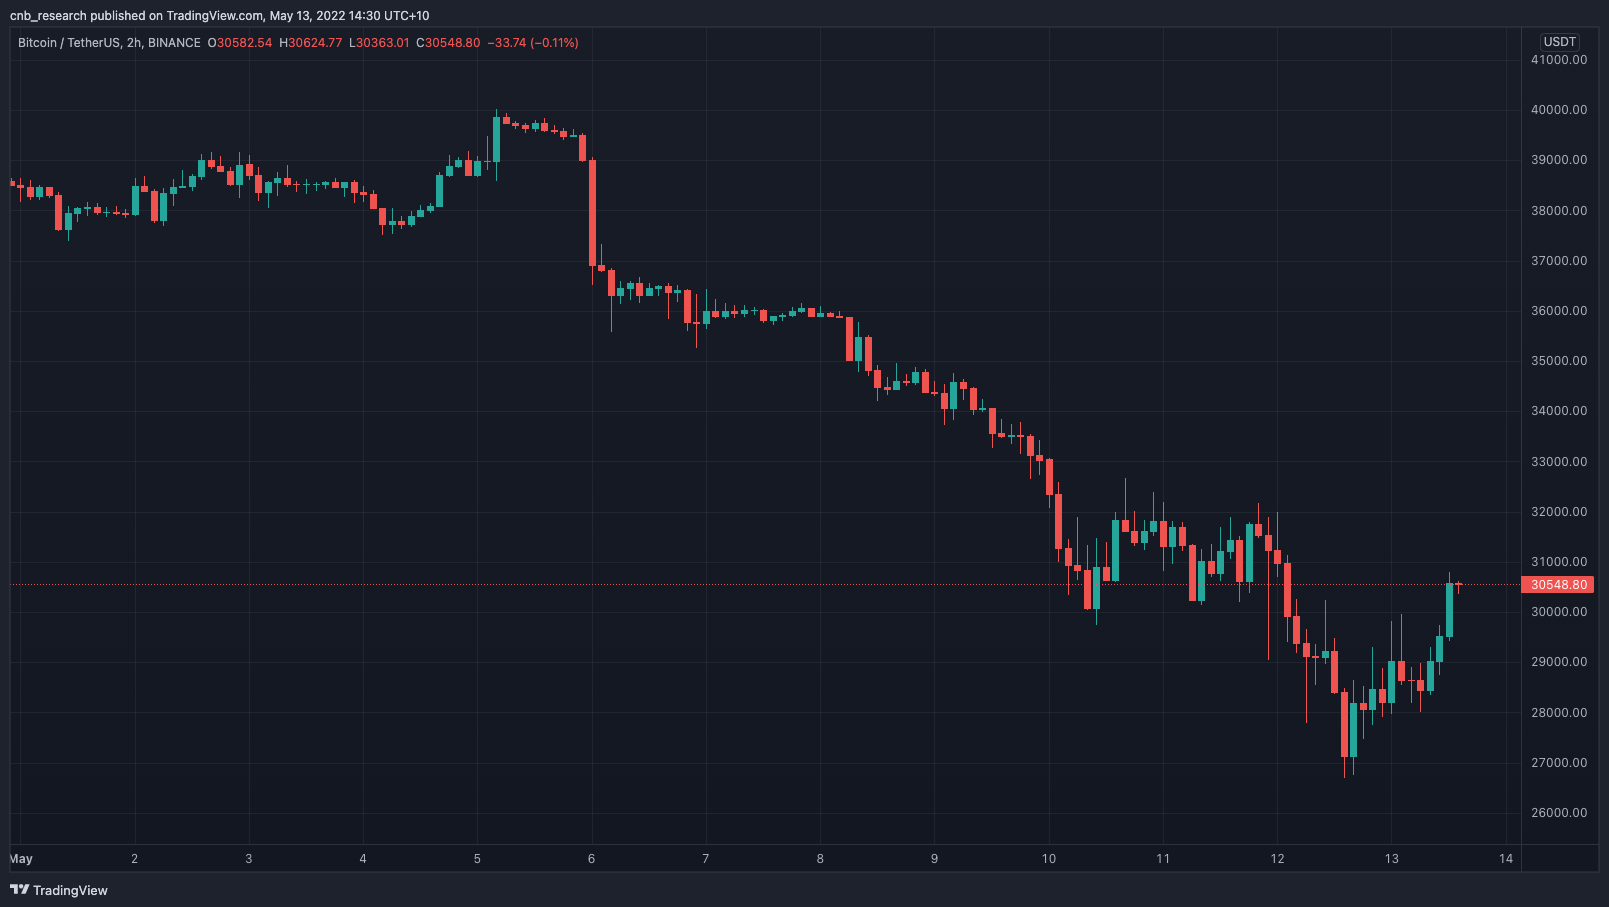
Bitcoin’s downtrend can again largely be attributed to weakness in traditional markets. The Nasdaq (one of the largest stock indexes in the US that contains a high concentration of technology stocks) fell almost 7% in the last week, dragging BTC with it. According to Arcane Research, the BTC-Nasdaq correlation has grown to a new ATH of over 0.8. While Bitcoin is being driven down lower due to macroeconomic factors, there was also the expectation that Luna Foundation Guard (LFG) would be forced to be Bitcoin sellers to restore the UST peg in an attempt to save the network. These factors created significant fear in the market, pushing all asset prices lower. Terra’s collapse has since sent shockwaves through the crypto market and driven lasting fear into all investors, from Bitcoin maxi’s to stablecoin holders.
Ethereum
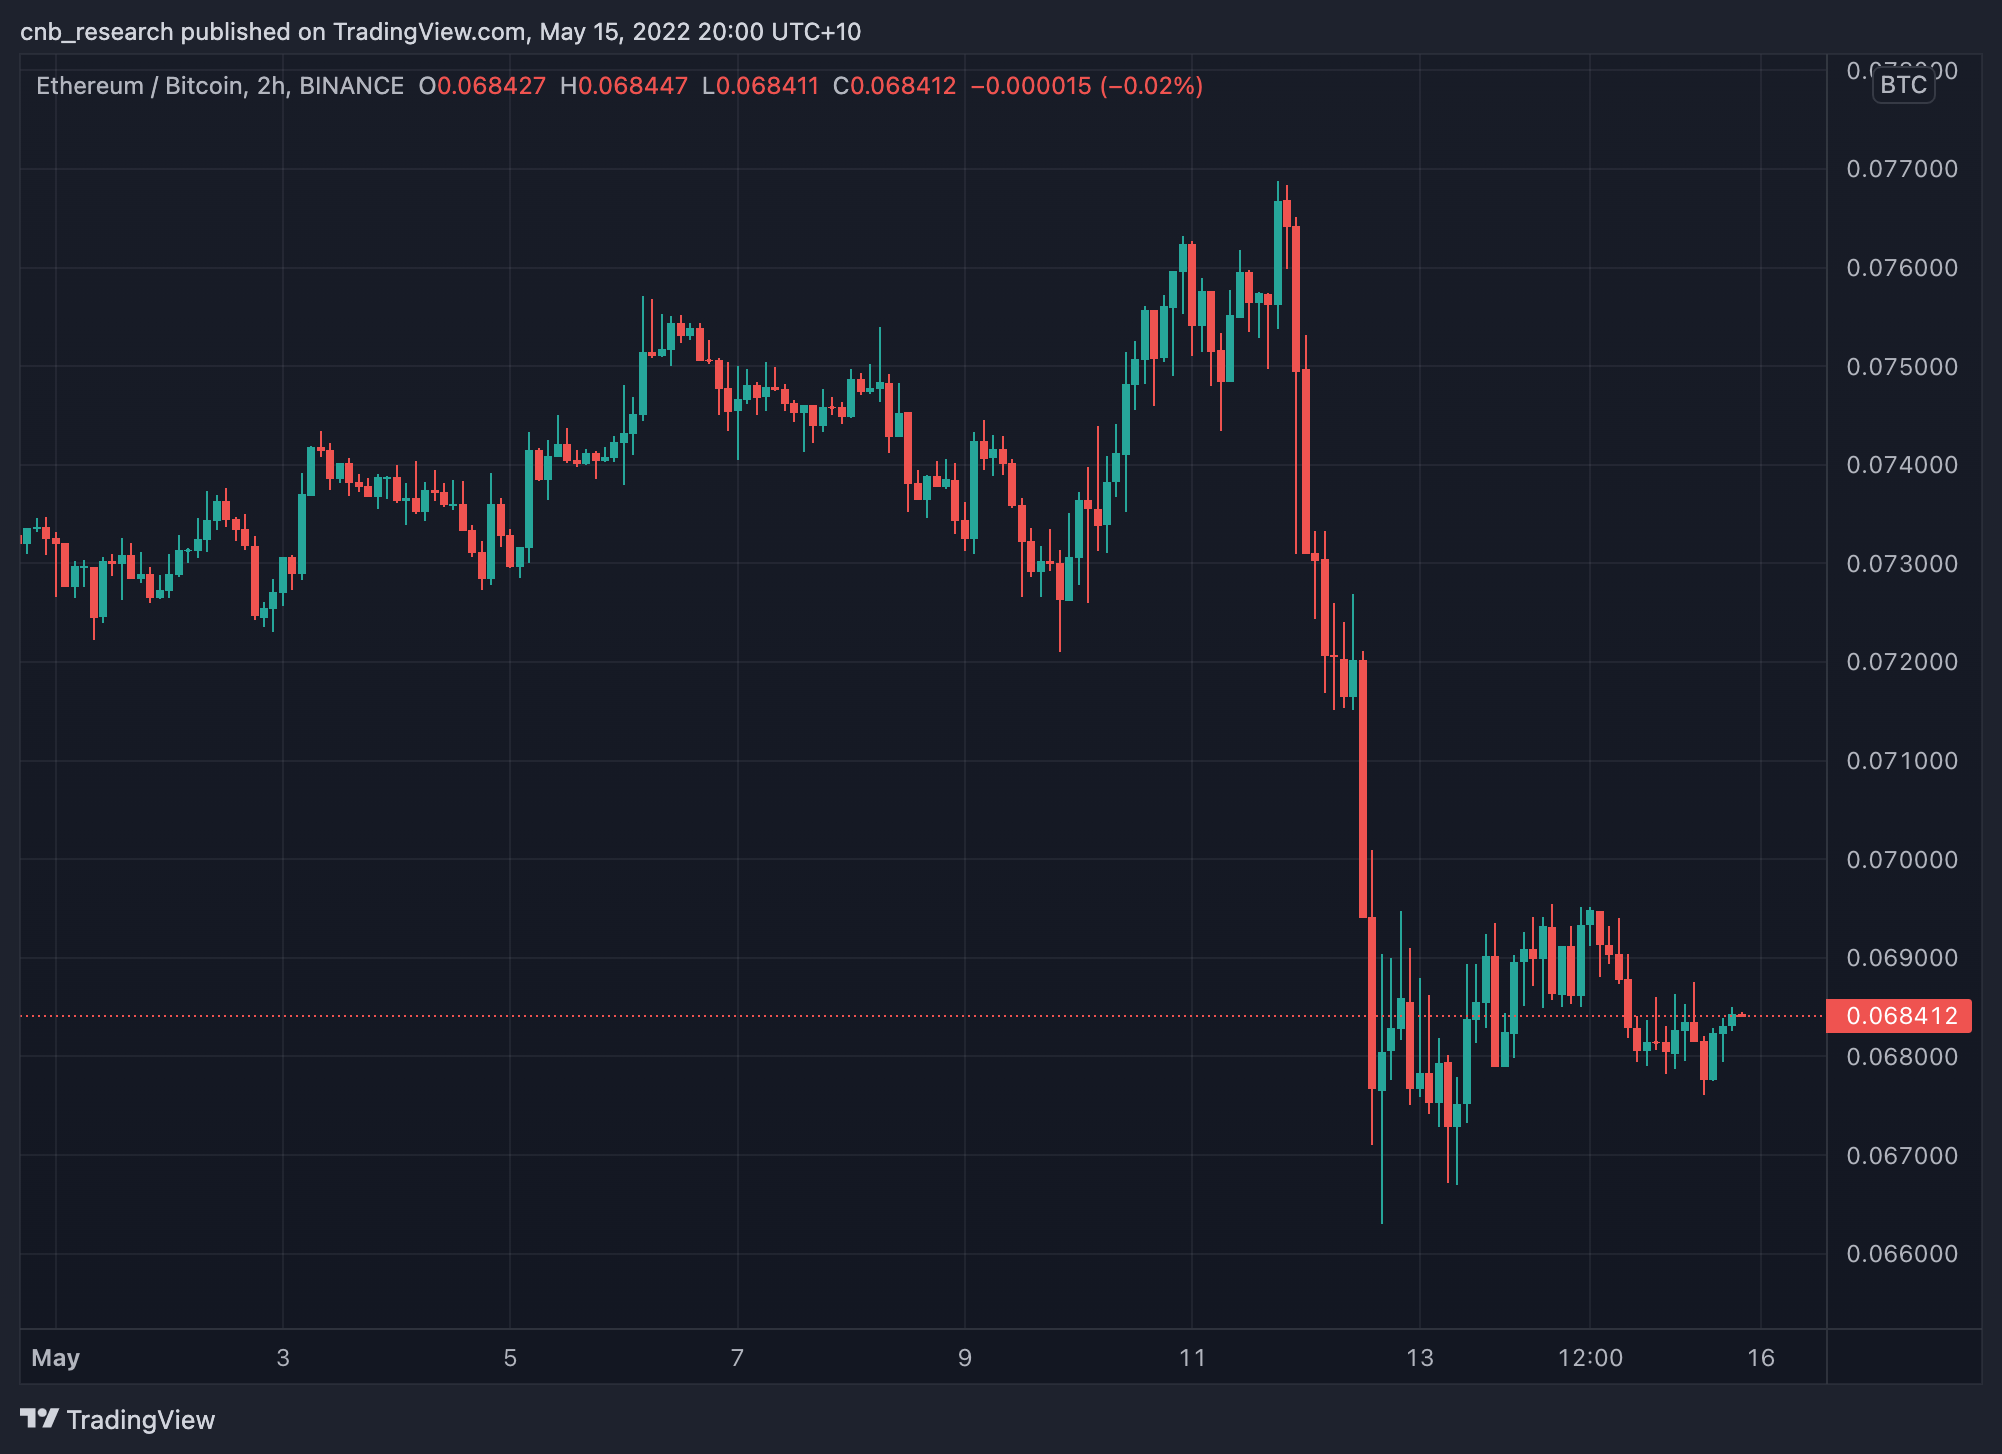
When looking at the effects to ETH/BTC, Ethereum dropped sharply against Bitcoin as we saw signs of altcoin capitulation over the last few days. Ethereum tends to underperform against Bitcoin when the cryptocurrency market experiences volatility to the downside, and this time it was no different. Ethereum dropped 13% more than Bitcoin in a single day when the market plummeted. Most altcoins traded in a similar fashion to ETH; losing significant value against Bitcoin, and even more against USD.
Altcoins
Friday the 13th came true as terror settled across the markets this past week. Close to $380 billion has left the market, leaving the total cryptocurrencies market cap at $1.2 trillion.
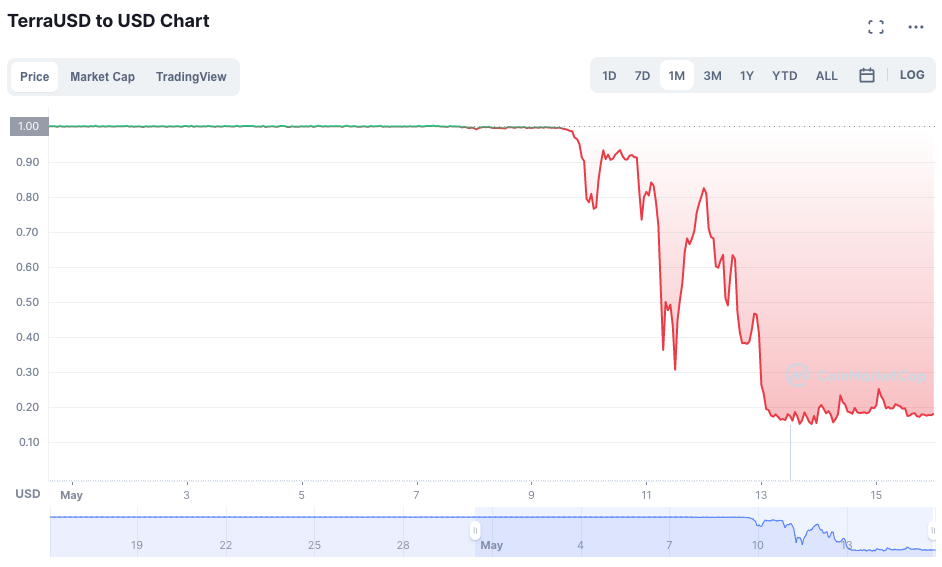
The Terra protocol, one of the most prominent Layer 1 protocols in crypto underwent a collapse of monumental proportions with the depegging of TerraUSD (UST), bottoming out at 0.06 cents and the 100% decline in the price of their governance token, LUNA. So what happened exactly? We unpack the largest collapse in crypto history here.
During the fortnight, every cryptocurrency sector has seen double-digit losses, with Web3 taking the biggest hit. All top assets by market capitalisation traded in unison as they made new lows this week. AVAX had the biggest loss amongst smart contract platforms with a 47.5% decline on the weekly. The DeFi sector was among the worst performing of the week, with some assets around the 50% drawdown territory. Notably, THORChain with a 54% decline. Web3 saw the sharpest decline across the board, with an average drop of 41% from assets such as Chainlink, Filecoin, Theta, Helium, Audius, The Graph, Arweave, etc. in-app actions, these mechanisms will help reduce the GMT and GST token circulation, which is meant to help increase their long-term price action.
NFTs
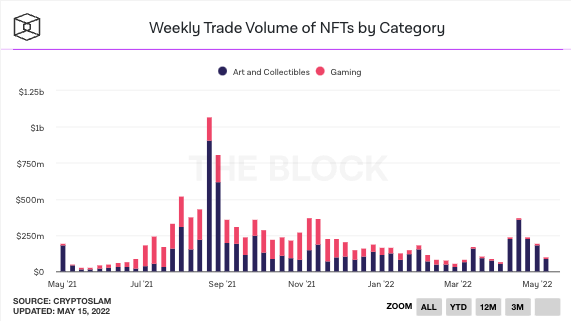
The NFT space saw a crazy start to the month due to Yuga Labs highly anticipated launch of their Otherside Metaverse project. The project generated over $560 million in NFT sales just within the first 24 hours of the launch, making it the highest earning mint ever. However, critics of the launch were quick to flock to twitter and call out Yuga Labs for the suboptimal launch which caused gas fees to spike enormously, costing users over 30,000 ETH (~$95m) within just the first hour.
Despite this manic launch, NFT trading volume has dwindled since, with number of total transactions falling over 50% from previous months. This is most likely a response to the volatility currently seen in crypto markets, as investors look to reduce their risk exposure. The NFT space has usually maintained high activity during volatile times and the dissipating volume may be indicative of the broader market sentiment.
Further reading: A Week of Terra: The UST & LUNA Collapse Explained
from Caleb & Brown Cryptocurrency Brokerage.


